EVOKEWAVE
Automated measurement & data analysis system
for high speed (electro)physiological multi-channel recording
Introduction
The development of computer technology have revolutionized physiological measurements – monitoring, recording
and analysis of physiological parameters and controlling of experiments. However, the complexity of the tasks have
lead to development of either very specific task oriented programs or general purpose recording programs. If such
programs provide sufficient flexibility that enables the users customizing the measurement to their specific needs,
they are often too complex and need high computer skills or learning a specific programming language.
Evokewave
has
been
developed
with
the
idea
to
provide
scientists
(physiologists,
electrophysiologists,
pharmacologists) with a general purpose high speed physiological recording program that is still simple to learn and
use but provides powerful online and offline analysis capabilities and a high flexibility for customizing for different
tasks. This hardware-software system is specifically designed to deal with triggered phenomena (evoked potentials,
reflex responses, stimulation evoked muscle contractions, etc.). However, it can be used for recording and analysis of
spontaneous events as well.
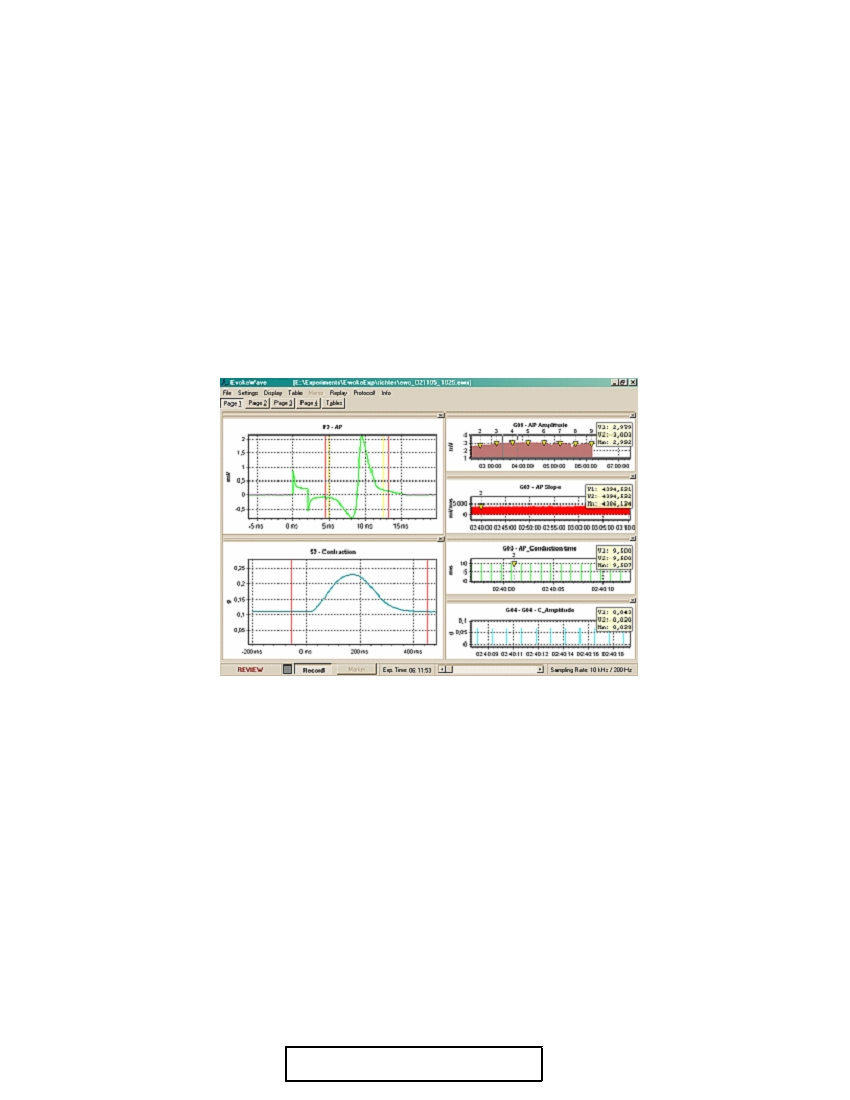
An example display: A Fast/Slow scope-pair (left) and 4 calculated parameter graphs (right) on Page 1.
Short general description of the system:
1) The hardware is a PC interface with analog-digital converters (National Instrument DAQ “E series” board).
It comprises 8 analog inputs, a trigger input and 4 digital outputs (DO) for controlling stimulators or external
devices. (the digital outputs are functionally active only with the optional programmable stimulator modul.
Otherwise only a trigger output is active.)
2) The system emulates 8 oscilloscopes to display and record the input signals on a fast time scale of milliseconds.
However, the oscilloscopes are organized in 4 pairs of fast and slow scopes. The latter can be set to reduced
sampling rates to record slower and longer lasting signals if needed without unnecessarily wasting of storage
capacity. The oscilloscopes are triggered either by external stimuli or can synchronize with internal pulses
generated by the system and display/store both pre- and post-trigger segments. Scope trace data can be
averagrd. The pre-trigger segments can be used for special calculations, such as offset (baseline) subtraction.
3) The system also features online analysis tools (algorithms) that extract analyzed data from the displayed scope
signals (e.g. amplitude, area under curve, delay time, etc.) and enable the experimenter to follow the changes in
the calculated parameters during an experiment on a slower (second/minute/hour) timr scale. The correct
analysis is supported by post-trigger time based (vertical) range cursor pairs and a (horizontal) threshold cursor
to discard artifacts. The extracted data are displayed on digital displays and time-parameter graphs . These
graphs are like traditional chart records, except that the software provides simple and powerful tools of viewing
and scaling (extending or compressing) along both axes on-line as well as offline.
UNISIP Ltd. [info@unisip.hu]
4) The system stores all the scope traces (individual or averaged) and online extracted data (graph data) as well as
settings (setup data) in one bundled file for each experiment that might last for up to 24 hours. This bundled
file management is very simple for the user and enables Reviewing or Replaying the experiment. In Review
mode the extracted parameter graphs and associated scope signals at selected time points are displayed, thus
enabling quick reviewing of the records of an experiment with easy jumping to any time-point or experimental
phase and connecting changes in scope traces and graph data. The Review mode also allows easy and quick
evaluation of the graph data using two reader cursors and output tables. Scope traces and graph data can be
easily exported for use in other scientific data analysis/plotting programs (e.g. Excel, Origin, GraphPad,
SigmaPlot, etc.). In Replay mode the scope traces of an experiment can be replayed and reanalyzed with
different online analysis settings from those in the original experiment. System settings for a specific
experiment type can be stored also in a separate Setup file for easy customizing.
System Requirements
1 GHz or better processor
512 MB RAM
PCI or AGP video with 64 MB RAM
1 free PCI slot (or 1 free PCMCIA slot in Notebook)
min. 20 GB HDD, preferably more
min. 17" monitor
mouse with scroll button or 3 buttons
Windows XP
Main Features
EvokeWave offers a wide rangr of automated measurement functions.
The most important features:
Basic features
Simultaneous monitoring, recording and analysis on 8 Oscilloscopes (4 channels of Fast-Slow pairs), and 16
chart-recorder like calculated Graphs
Four modes of operations (Setup, Experiment, Review, Replay)
High speed Scope displays with curve-memory* (up to 5 memo curves / Scope)
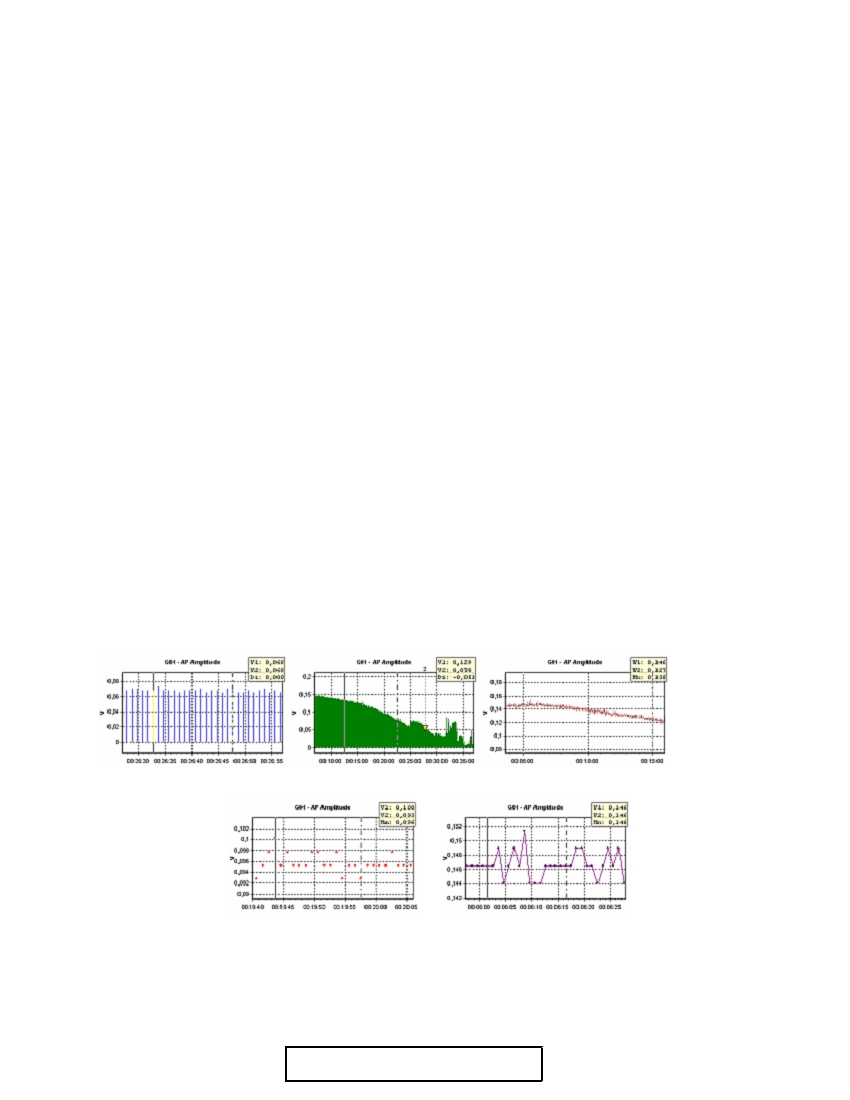
Four types of plot modes in the Graph displays (Bar, Line, Dot, Dotted Line)
bars
compressed bars
line
dots
dotted lines
Easy scroll forward, backward, up and down with mouse
Scroll-back during recording - freely movable curves, no scroll-back time limit!
Replay function with selectable replay-speed
2
UNISIP Ltd. [info@unisip.hu]
Layout, user interface
4 pages for fully flexible, user defined, customized layout settings
Interactive screen elements
Dockable scopes and graphs with automatic resize feature
Environment settings
Replay functions with freely definable replay speed
Annotation Marker functions during recording
Markers displayed on charts and recorded into Marker-table (log book)
Selectable marker-format on charts
Full online analysis during recording - no need to leave or suspend actual data recording
User selectable time format (hh:mm:ss or mmm.mmm)
Interactive numerical displays with selectable values
Zoom into a specific segment of curve - only with one mouse event (looping)
Two types of data evaluation modes (1 cursor and 2 cursors)
Data tables associated with each channel for collecting evaluated data
Multiple evaluation features, e.g. baseline subtraction, parameter selections, etc.
Wide range of export modes: data-tables, full chart data, chart segment data and JPEG
Bundled experiment file - all data and information (including setup settings) are packed into one file
Shutdown-safe storage - easy-to-fix experiment file recovery after unexpected shutdown (power cut)
Default Setup (automatically loaded at program start)
Default names (with date/time) offered for experiment - and export-save functions
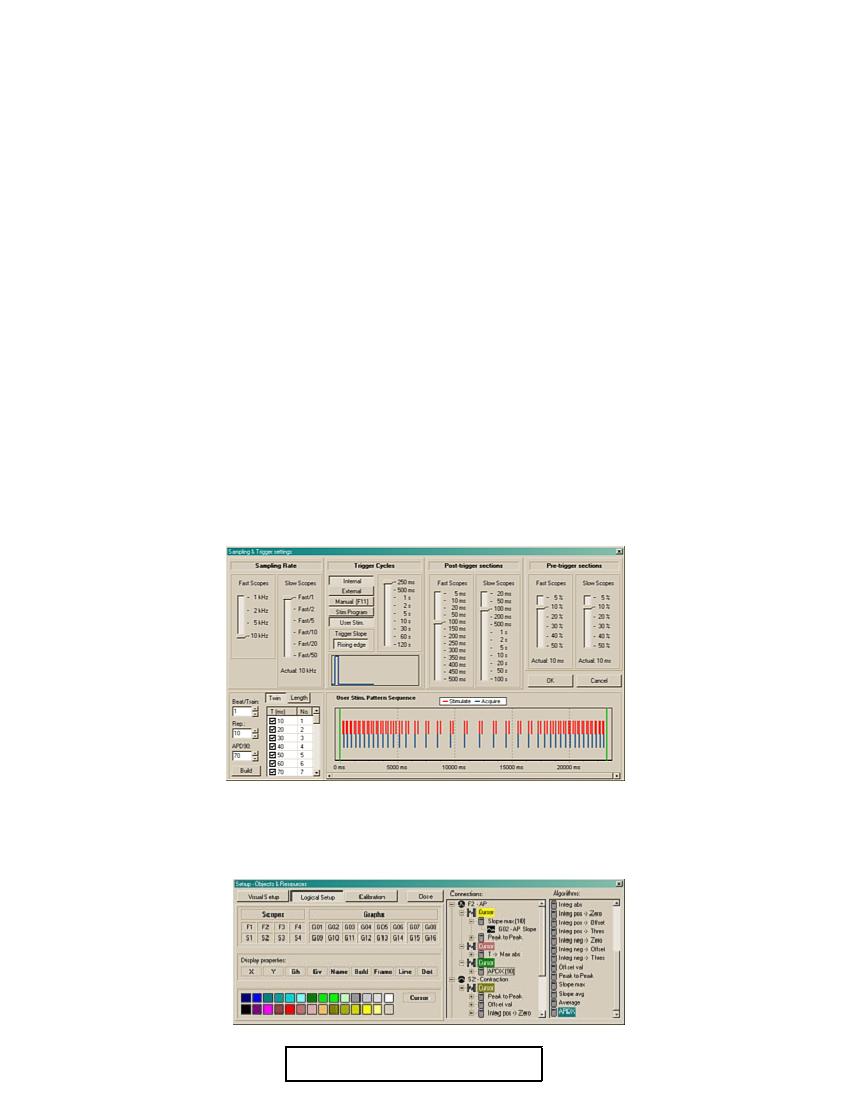
Sampling & Trigger settings
User defined Sampling Rate in the range of 1kHz-10kHz / channel
Sampling Rate divider for Slow signals
Three trigger modes (Internal, External or Manual)
Scaleable Trigger-cycle times (500 ms - 120 sec)
Defineable pre- and posttrigger sections
Switchable trigger-slope type (Rising edge / Falling edge)
Optional programmable stimulator
Setup, configuration with Objects & Resources
Easy and spectacular configuration with Resource Setup panel using drag’n’drop and dock techniques
Dynamically sssignable cursor-pairs and algorithms (4 algorithms / scope)
Algorithms for calculations (23+ calculation types; extendable upon request)
3
UNISIP Ltd. [info@unisip.hu]
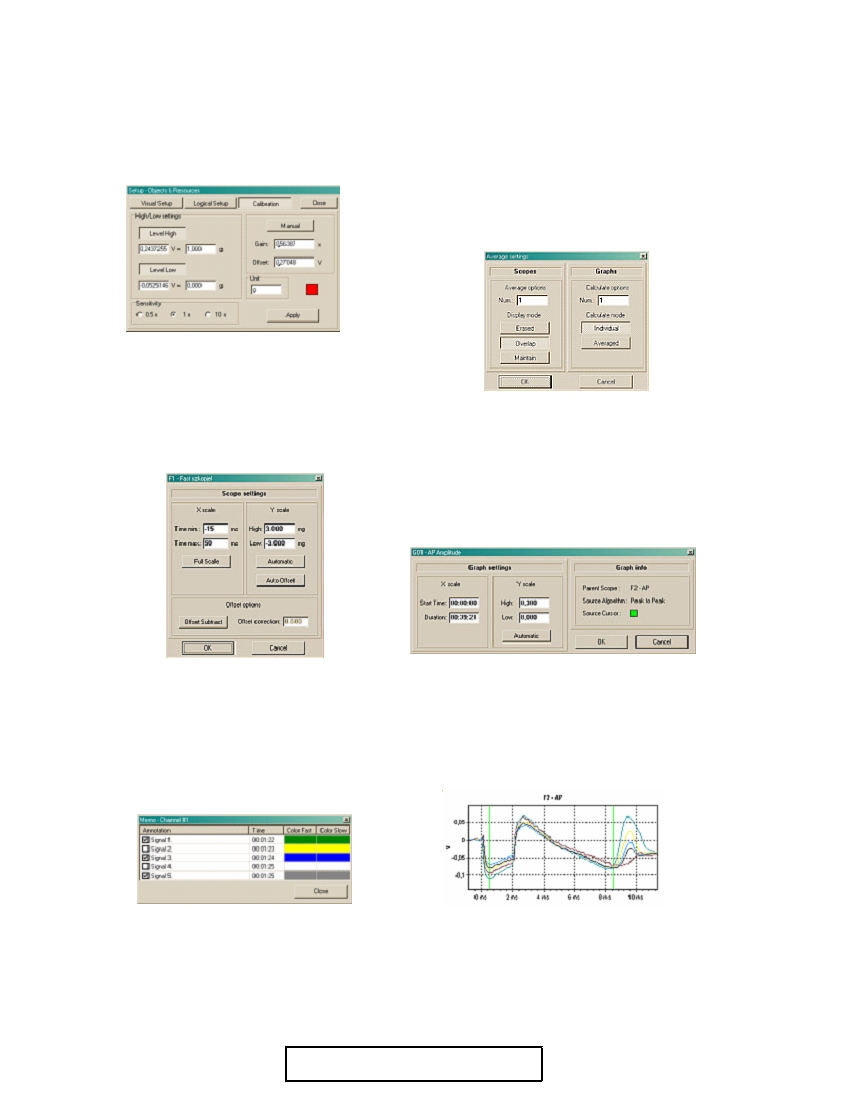
Calibration
Average settings
Two calibration types (High/Low or Manual)
Individual average settings for Scopes and Graphs
Selectable input sensitivity range
Unlimited average number with three types of averages in
Scopes (Erased, Overlap, Maintained)
Unlimited average number with two types of averages in
Graphs (Individual, Averaged)
User defined visual settings for individual and averaged curves
Scope & Graph display settings
Quick display settings with just one click
Auto Offset and Offset Subtract options for Scope signals
Scope settings
Graph settings - with into field
* Memo curves
Curve memory (5 curves / Scope)
User defined curve-colors
Free recall - selected memo-curves can be displayed at one time
Memo table
Scope with memo curves
Contact
Please do not hesitate to contact us if you are interested in our product or need more information.
E-mail: info@unisip.hu
4
UNISIP Ltd. [info@unisip.hu]