ISORGAN
automated measurement & data analasis system
for multi-channel recording
Introduction
Having good process control is an indispensable requirement today with strong impact on competitiveness in both
science and industry. Development of computer systems gives new opportunities but also establish higher demands
regarding process control and data management.
Appreciating the needs of the industry and science UNISIP Ltd. provides numerous devices and hardware/software
systems for automated measurements and industrial process control. We have had continuous special collaboration for
several years with the Hungarian pharmaceutical company Gedeon Richter Ltd. and many of our products are used in
Richter.
Our new product Isorgan has been developed in co-operation with experienced pharmacologist research staff at
Richter to provide an effective measurement system that fulfils data acquisition and management needs of
physiological and pharmacological studies. The system was designed to replace the traditional multi-chart paper-
recording particularly in studies of isolated organs and tissues; but due to its powerful data managament capabilities it
is much more than a recorder, providing effective tools for data displaying, recording, reviewing, evaluation, data
presentation and documentation. Despite the powerful services, the software was designed to be user friendly and
easy-to-use, does not need special technical or computer skills, and an average technician can learn its use very
quickly.
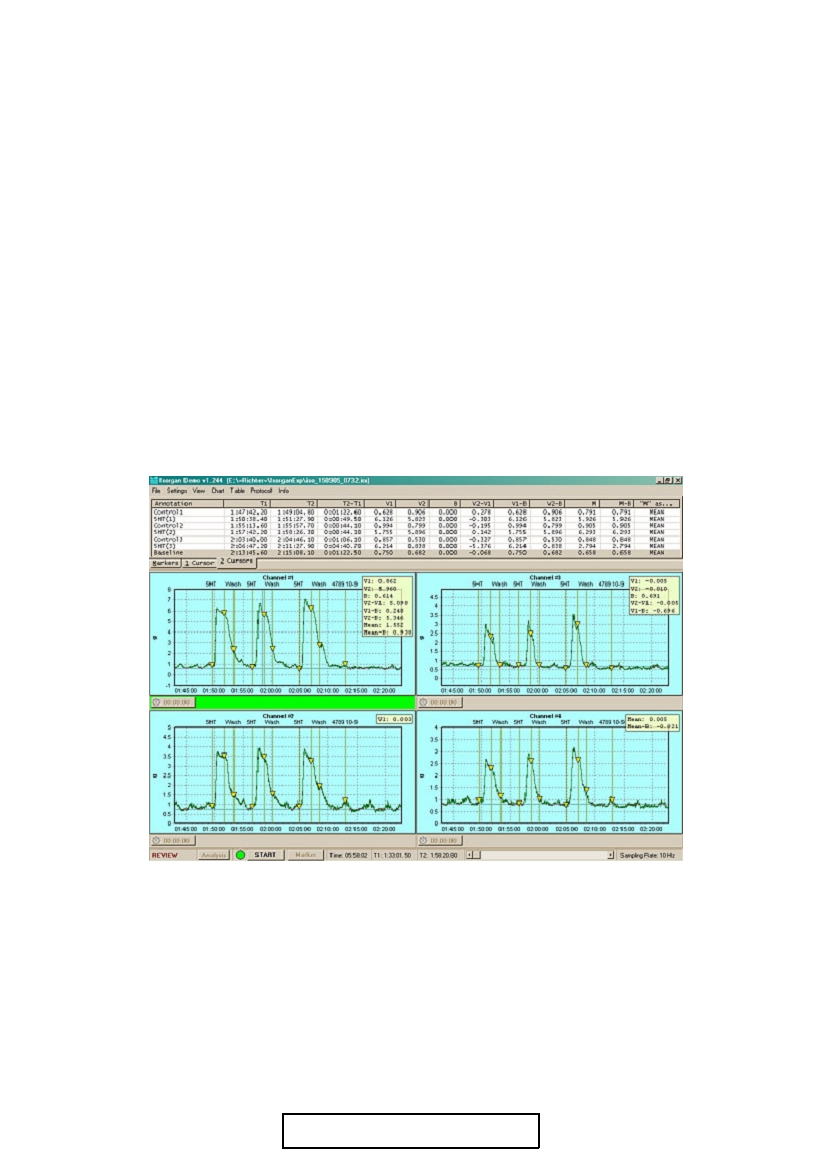
A typical display with 4 channels and evaluation data-tables
System Requirements
1 GHz or better processor
512 MB RAM
PCI or AGP video with 64 MB RAM
1 free PCI slot (or 1 free PCMCIA slot in Notebook)
min. 20 GB HDD, preferably more
min. 17" monitor
mouse with 3 buttons
Windows XP
UNISIP Ltd. [info@unisip.hu]
Main features
Isorgan offers a wide range of automated measurement functions.
The most important features:
User defined Sampling Rate in the range of 1-100 Hz
Parallel monitoring, recording and analysis on up to 8 channels
Default Setup (automatically loaded at program start)
Fast 1 or 2 column chart-apportionment, with automatic chart-sorting and resizing
Two calibration types (High/Low signal or Manual) - [**]
Selectable input sensitivity range - [**]
Protocol Box for previously prepared protocols
Strip-chart displays with user defined- and auto-scale X and Y option, and automatic step function
Easy scroll forward, backward, up and down with mouse
Scroll-back during recording - freely movable curves, no scroll-back time limit!
Annotated Marker and Extra Marker functions during recording
Markers displayed on charts and recorded into Marker-table (log book)
Selectable marker-format display on charts
Quick Jump-To-Marker function
Full online analysis during recording - no need to leave or suspend actual data recording
User selectable time format (hh:mm:ss or mmm.mmm)
Interactive numerical displays with many functions - [*]
Zoom In and Zoom Out rescale function only with one mouse event (looping)
Two types of data evaluation modes (1 cursor and 2 cursors),
Data tables associated to each channel for collecting evaluated data
Fast data-table show/hide with F12
Multiple evaluation features, e.g. baseline subtraction, parameter selections, time-stamps, etc.
Wide range of export modes: data-tables, full chart data, chart segment data and JPEG
Bundled experiment file - all data and information (included setup settings) are packed into one file
System-safe recording mode - easy-to-fix experiment after unexpected shutdown
Default names offered for experiment- and export-save functions
Stopwatch for every chart
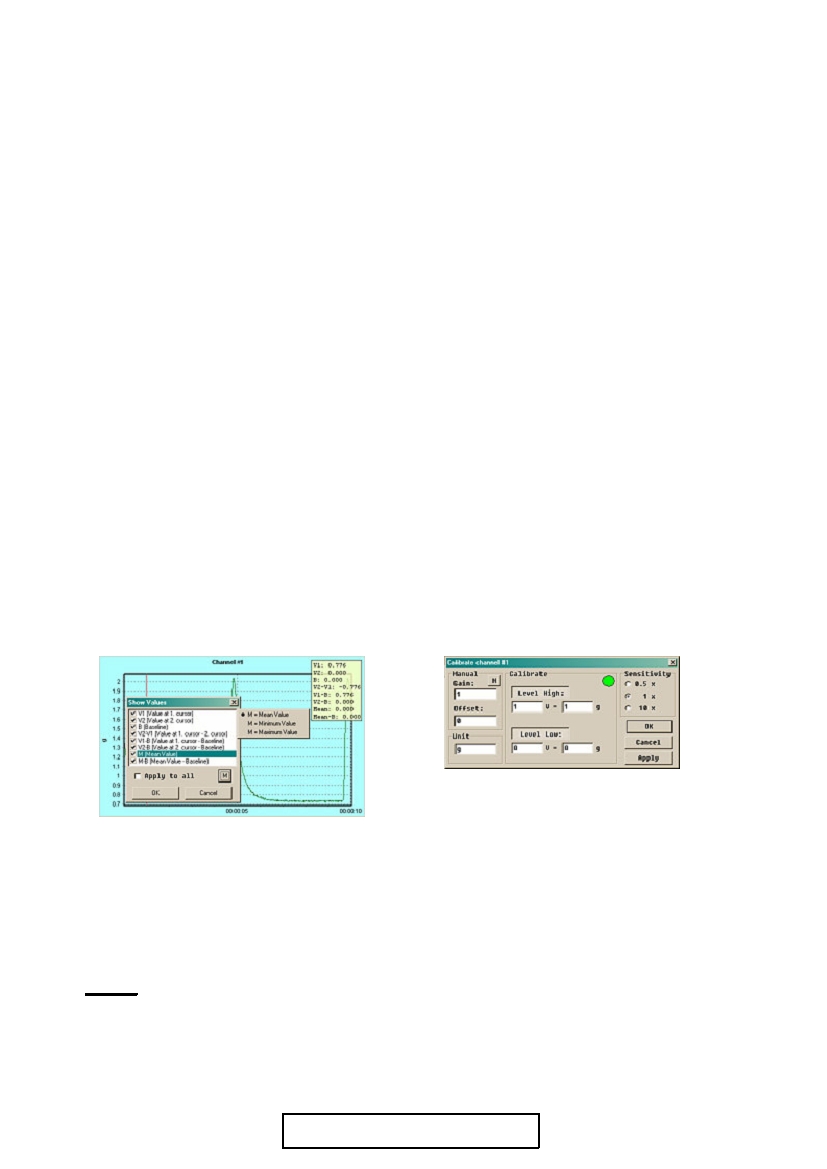
Calibrate [**]
Two types of calibration are available.
Show Values [*]
The Manual type requires a Gain and an Offset value.
The High/Low type is a two-point calibration - it picks
Every chart has its own value-list, which is
up a high and a low value shown by the user via the AD
displayed at the top right corner. This value-list
input, and converts the measured voltage to user defined
is freely configurable in Show Values panel.
unit values.
“*”-value is a specific item, which can be Mean,
Minimum, or Maximum.
(High precision, real-time data acquisition is based on
National Instruments DAQ hardware.)
Contact
Please do not hesitate to contact us if you are interested in our product or need more information.
E-mail: info@unisip.hu
UNISIP Ltd. [info@unisip.hu]